First off, I would like to thank you for choosing to read this post, as it is my first attempt at a LinkedIn post/blog. Hopefully I will be able to provide some useful information.
As a developer, I would consider myself still in the “junior developer” realm, but I have also learned a lot of things in my professional career that I wish I had known while still in college. The absolute most beneficial thing that I have learned is how to track down a bug. This also happens to be one of the things that I most enjoy doing (I guess you could say I’m a bit of a masochist). While I am sure that most of these tips I offer are known far and wide, hopefully you will learn something helpful too.
To start off with, the most rudimentary debugging trick is use to console logging. You simply insert a command to write the value of a variable at some point in your code to the console, run the application/program, and see if it spits out what you expected it to. Hopefully, you remember to clean up these statements in your giddiness of fixing whatever the problem might be. If not, chances are your team members will laugh when they see something like “How did it get here?” or “Oops” (among other, probably a little more NSFW things – never underestimate the ability of a frustrated geek to come up with hilariously awful comments). This was pretty much my entire arsenal of debugging weapons in college.
I didn’t learn about the glorious breakpoint (the red dot in Figure 1) until shortly before graduating from college and entering the workforce.

[Figure 1]
Yes, I called breakpoints glorious. Even when someone forgets to delete the breakpoints, and suddenly your application comes to a complete halt and you spend several seconds staring slack jawed at the running application before noticing the icon for your IDE is blinking at you from the taskbar they are still glorious, just not as glorious as usual at that moment. That ability to effectively “stop time” for the application so you can “look under the hood” is priceless. One breakpoint can be worth a thousand console logs. And they’re so EASY to use too! Just click to the far left of the line of code you want everything to stop at (this line of code will not be executed before everything stops, remember that). At this point, you can do all sorts of neat things:
- You can hover over any variable that is currently in play in the application and find out what value it holds. As demonstrated in Figures x and x.
- You can change the value of any of those variables before resuming the running of the application (this is excellent if you know the problem lies along a specific branch of logic, but don’t feel like having to figure out the exact inputs in the interface that takes you down that branch).
- You can “rewind” the current process to double check something (or if you realized that you should have set the breakpoint a couple lines earlier than you actually did) or “jump” to a specific line of code and execute that next (for instance, if you want to test some business logic while skipping all those pesky database operations). However this could easily lead to unexpected results and cause more confusion than clarity. This is demonstrated in Figure 2, and is accomplished by clicking and dragging the yellow arrow up and down the file.

[Figure 2]
Once you’ve hit a breakpoint, you can easily resume execution of the application as normal, or you can step through it one line of code at a time and watch things change.
So now that you have been introduced to the wonders of the breakpoint, I must caution you. In certain situations, debugging can still be somewhat of a pain. For instance, let’s say there is a list of objects and one of those objects has some wonky data in it, and your mission, if you choose to accept it (or still yours if everyone else is busy incentivizing front-end networks, maximizing cross-platform content, or are seized up due to analysis paralysis from living on the bleeding edge of your client-centric technologies – you’re welcome buzzword bingo players!) of figuring out why it’s wrong. And to make it a little more interesting, let’s say that there are 200 objects in this list. Normally, when you hover over the list you’re going to see something similar to Figure 3.
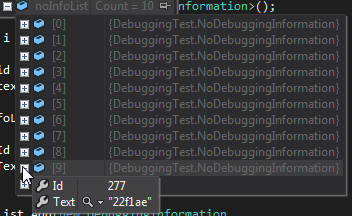
[Figure 3]
This is what I call “finding a needle in a haystack”. With enough persistence, you will find the offending object, however it’s going to take you more than a minute. However, you are probably going to have to examine this list several times while you troubleshoot the problem, and if you forget to note exactly which element the offending object is in the list (and it WILL happen…oh yes, it will)? Congratulations, you just lost a life in a real life “Ghosts ‘N Goblins” game and you have to start over at the very beginning, armed with just enough knowledge of what lies ahead to do it a little bit faster next time. How can you prevent this? Well, through a feature that I just recently learned about myself – DebuggerDisplay.
I think the only thing that I would get more excited about finding than I was when I found DebuggerDisplay would be the Holy Grail; or ten thousand dollars. I would be extremely excited if I found ten thousand dollars as well. If you’d like to help out with that, just send me a message and I’ll give you the location of the post office box to hide it in. No? Ok, back to DebuggerDisplay then.
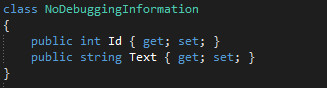
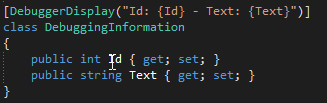
DebuggerDisplay is a .Net attribute tag that you can decorate your class definition with that tells the debugger how to display objects of that class. It uses what I call “liquid variables”. They are the property name surrounded by curly braces. As an example, if the object has a property named “Id” (I know, weird that an object would have an id, right?!) and you wanted to display the list of objects as their Ids you would put [DebuggerDisplay(“{Id}”)] as an attribute on the class itself, then when you hover over the list of objects, you would see something similar to Figure 4. Now you don’t have to drill into each object in the list until you find the correct one, you would just scroll through the list until you found the Id of the object you were looking for. You can customize this to look however you like, as an example, if you look at Figure 5, you will see that I’m using TWO liquid variables, “{Id}” and “{Text}”, as well as some hardcoded text to provide context. Figures 5 and 6 show the class definitions of the classes I created for this post.
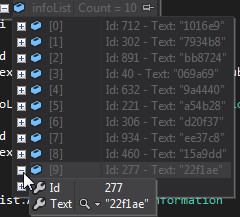
[Figure 4]
[Figure 5]
[Figure 6]
Well, that’s all for this post. These tips and tricks are centered around .Net and C# because that is what I have the most experience with, so I make no guarantee that these will work with your preferred language of choice. If you know of any other debugging tricks or tips, please leave a comment sharing it.